
Living through one’s teenage years is never easy, but for today’s teens, it seems harder than ever to enjoy a happy, healthy adolescence.
Late in 2021, the U.S. Surgeon General released a new advisory on youth mental health, drawing attention to rising rates of depressive symptoms, suicidal ideation, and other mental health issues among young Americans. According to data cited in the advisory, up to one in five U.S. children aged 3 to 17 had a reported mental, emotional, developmental, or behavioral disorder. Many of these worrying conditions predated the COVID-19 pandemic, which worsened mental health for many young people by disrupting their routines, limiting their social interactions, and increasing stress about the health of loved ones.
These trends in youth mental health can be attributed in part to detrimental shifts in young people’s lifestyle over time, including increased academic stress, growing use of digital media, and worsening health habits. And one of the major potential culprits in the latter category is sleep.
According to the CDC, teenagers should sleep between 8–10 hours per 24 hour period. This level of sleep is associated with a number of better physical and mental health outcomes, including lower risk of obesity and fewer problems with attention and behavior. Despite this, less than a quarter of teens report sleeping at least eight hours per day—a number that has fallen significantly over the last decade.
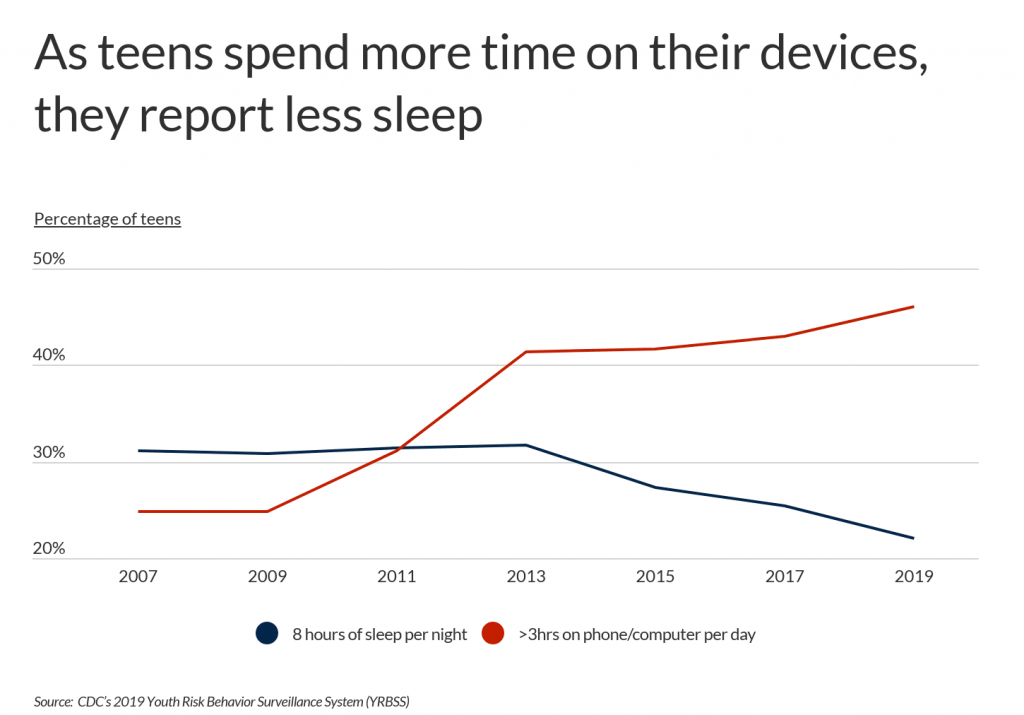
From 2007 to 2013, just under one-third of teens reported getting at least eight hours of sleep per night. In 2015, that number began to fall, and by 2019, only 22.1% of teens were meeting that threshold. One likely contributing factor is a rise in device usage over the same span. In 2007—the same year that the iPhone launched—24.9% of teens were spending more than three hours on their phone or computer on a given day. In 2019, that figure had risen to 46.1%.
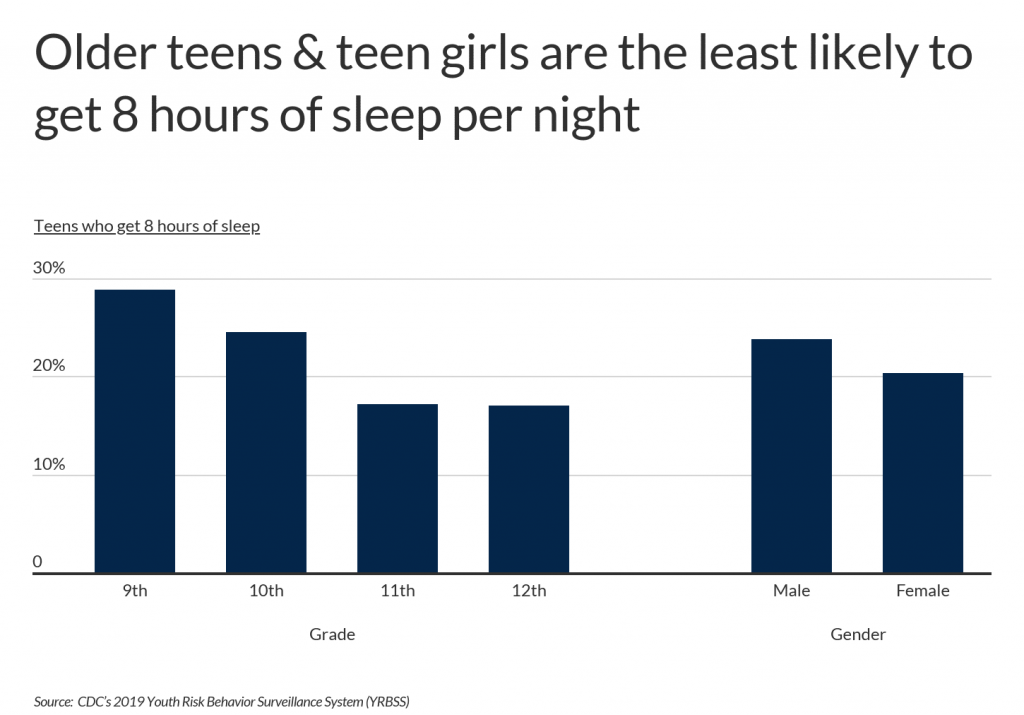
While the overall numbers for teens’ sleep habits are concerning, some subgroups are getting more sleep than others. Age is one factor: as teenagers get older, the share reporting that they sleep at least eight hours declines. Among 9th graders, 28.9% are sleeping more than eight hours, but for 11th and 12th graders, only around 17% are. There is also a slight separation along gender lines, with 23.8% of males receiving adequate sleep compared to just 20.3% of females.
TRENDING
With access to thousands of potential job listings in a matter of seconds, and the ability to upload a single resume to apply for dozens of jobs, it’s no wonder online job search engines are the most popular way to look for work. Here are the best job search engines of 2022.
Another difference among teens’ sleep habits is geography. Teenagers in different states report different levels of sleep, along with other related habits like regular exercise or time spent with a phone, computer, or TV. For example, a mere 15.7% of teenagers in New Jersey are getting enough sleep—just over half the percentage of well-rested teens in Montana (29.9%), the state with the highest reported share.
The data used in this analysis is from the CDC’s Youth Risk Behavior Surveillance System (YRBSS), which surveys a representative sample of grade 9–12 students in U.S. schools. To determine the states where teens don’t sleep, researchers at ChamberOfCommerce.org calculated the percentage of high school students who reported getting eight hours of sleep on an average school night. In the event of a tie, the state with the larger share of students who spent at least three hours per day on a phone or computer (including video games) for non-school use was ranked higher.
Here are the states where teens don’t get enough sleep.
U.S. States Where Teens Get the Least Sleep

15. Oklahoma
- Teens who get 8 hours of sleep: 21.1%
- Teens who spend >3hrs on phone/computer: 48.0%
- Teens who don’t exercise: 14.8%
- Teens who watch >3hrs of TV: 22.3%
DID YOU KNOW?
One path to financial freedom is to start and grow a successful business, and every business needs a website. Get your dream of financial freedom started by learning about the best, free website builders on the web.

14. Maryland
- Teens who get 8 hours of sleep: 21.0%
- Teens who spend >3hrs on phone/computer: 42.4%
- Teens who don’t exercise: 21.8%
- Teens who watch >3hrs of TV: 19.7%

13. Connecticut
- Teens who get 8 hours of sleep: 21.0%
- Teens who spend >3hrs on phone/computer: 47.9%
- Teens who don’t exercise: 17.7%
- Teens who watch >3hrs of TV: 22.7%

12. New York
- Teens who get 8 hours of sleep: 20.4%
- Teens who spend >3hrs on phone/computer: 40.1%
- Teens who don’t exercise: 20.0%
- Teens who watch >3hrs of TV: 17.8%

11. Florida
- Teens who get 8 hours of sleep: 20.2%
- Teens who spend >3hrs on phone/computer: 47.7%
- Teens who don’t exercise: 21.8%
- Teens who watch >3hrs of TV: 22.0%

10. Illinois
- Teens who get 8 hours of sleep: 20.1%
- Teens who spend >3hrs on phone/computer: 46.0%
- Teens who don’t exercise: 12.3%
- Teens who watch >3hrs of TV: 17.8%

9. South Carolina
- Teens who get 8 hours of sleep: 19.8%
- Teens who spend >3hrs on phone/computer: 40.1%
- Teens who don’t exercise: 20.7%
- Teens who watch >3hrs of TV: 21.5%

8. Pennsylvania
- Teens who get 8 hours of sleep: 19.6%
- Teens who spend >3hrs on phone/computer: 49.4%
- Teens who don’t exercise: 12.6%
- Teens who watch >3hrs of TV: 19.4%

7. Louisiana
- Teens who get 8 hours of sleep: 19.4%
- Teens who spend >3hrs on phone/computer: 40.4%
- Teens who don’t exercise: 25.5%
- Teens who watch >3hrs of TV: 24.6%

6. Kentucky
- Teens who get 8 hours of sleep: 19.4%
- Teens who spend >3hrs on phone/computer: 47.5%
- Teens who don’t exercise: 19.1%
- Teens who watch >3hrs of TV: 21.3%

5. West Virginia
- Teens who get 8 hours of sleep: 19.2%
- Teens who spend >3hrs on phone/computer: 41.7%
- Teens who don’t exercise: 14.7%
- Teens who watch >3hrs of TV: 20.8%
RELATED
Most stockbrokers have shifted away from a commission model and now offer free trades for U.S. stocks, mutual funds, and ETFs. To learn more about stockbrokers, and how to choose the right one for you, check out our guide to choosing the best online stockbrokers.

4. Tennessee
- Teens who get 8 hours of sleep: 18.5%
- Teens who spend >3hrs on phone/computer: 44.5%
- Teens who don’t exercise: 19.1%
- Teens who watch >3hrs of TV: 23.5%

3. Michigan
- Teens who get 8 hours of sleep: 17.6%
- Teens who spend >3hrs on phone/computer: 42.4%
- Teens who don’t exercise: 16.5%
- Teens who watch >3hrs of TV: 18.5%

2. North Carolina
- Teens who get 8 hours of sleep: 17.4%
- Teens who spend >3hrs on phone/computer: 46.4%
- Teens who don’t exercise: 19.9%
- Teens who watch >3hrs of TV: 20.1%

1. New Jersey
- Teens who get 8 hours of sleep: 15.7%
- Teens who spend >3hrs on phone/computer: 46.5%
- Teens who don’t exercise: 14.8%
- Teens who watch >3hrs of TV: 17.6%
Methodology & Detailed Findings
The data used in this analysis is from the CDC’s 2019 Youth Risk Behavior Surveillance System (YRBSS), which surveys a representative sample of grade 9–12 students in U.S. schools. To determine the states where teens don’t sleep, researchers calculated the percentage of high school students who reported getting eight hours of sleep on an average school night. In the event of a tie, the state with the larger share of students who spent at least three hours per day on a phone or computer (including video games) for non-school use was ranked higher. For additional context, statistics on exercise and TV watching habits were also provided. More complete descriptions of each variable can be found on the YRBSS website.