
Marriage—and divorce—in the U.S. today are starkly different than in earlier eras of the country’s history.
A series of economic, legal, and social shifts reshaped marriage in the second half of the 20th century. More women began working outside of the home in the post-World War II era, which provided avenues to financial security and independence outside of marriage.
Greater emphasis on postsecondary educational attainment and career development have led young people to wait longer to enter marriage. States began to adopt no-fault divorce laws throughout the 1960s and 1970s that made it easier to end a marriage. Meanwhile, changing social and cultural attitudes have made it more common for couples to cohabitate, combine finances, and raise children prior to getting married—or without getting married at all.
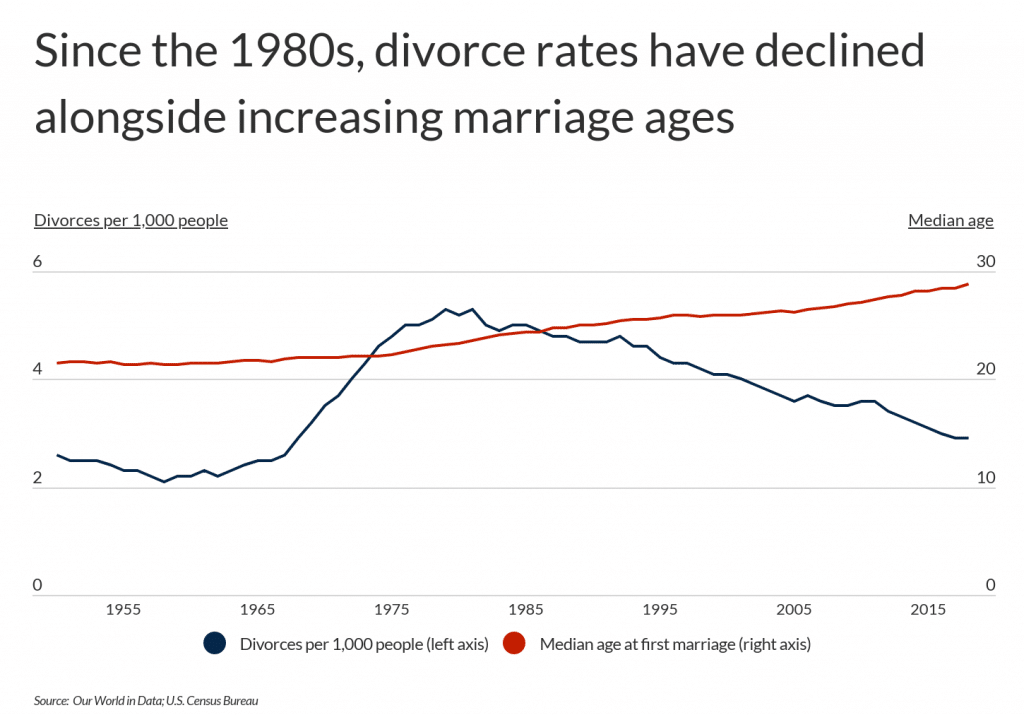
These trends have contributed to a decline in the overall number of marriages and to delays in when people get married for the first time. In the U.S., there are currently only 6.5 marriages per 1,000 people each year, compared to 10.9 five decades ago. For those who do choose to get married, the age of first marriage is happening later. As late as the early 1970s, the median age for a first marriage in the U.S. was just 22. By 2018, that figure had increased to 28.8.
These shifts have also affected how likely married couples are to stay together. As women entered the workforce in the mid-20th century and feminism and the sexual revolution took hold, rates of divorce rose quickly throughout the 1960s and 1970s. From 1960 to 1980, the divorce rate per 1,000 people in the U.S. more than doubled from 2.2 to 5.2. But the rate began to fall steadily after 1980, and as of 2018, the rate of divorce had dropped to 2.9 per 1,000 people.
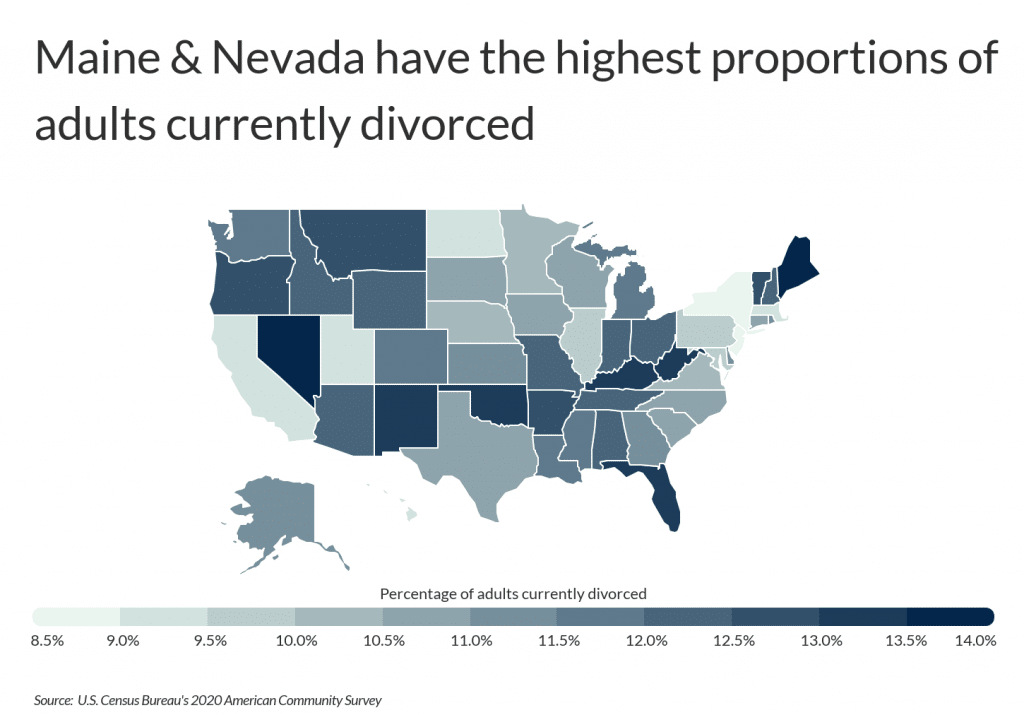
The link between rates of divorce and age at first marriage has been borne out over time, but it also explains geographic differences in rates of divorce. Today, most of the states with the lowest rates of divorce are also those with a higher median age for marriage. States like New Jersey, New York, California, and Massachusetts all stand out for having fewer than 10% of adults divorced and an age at first marriage above 30. One exception to this is Utah, which has the lowest overall median age for first marriage at 25.5 but also the third-lowest share of divorced adults at 9%, likely due in part to the state’s strong religious ties to the Church of Jesus Christ of Latter-day Saints.
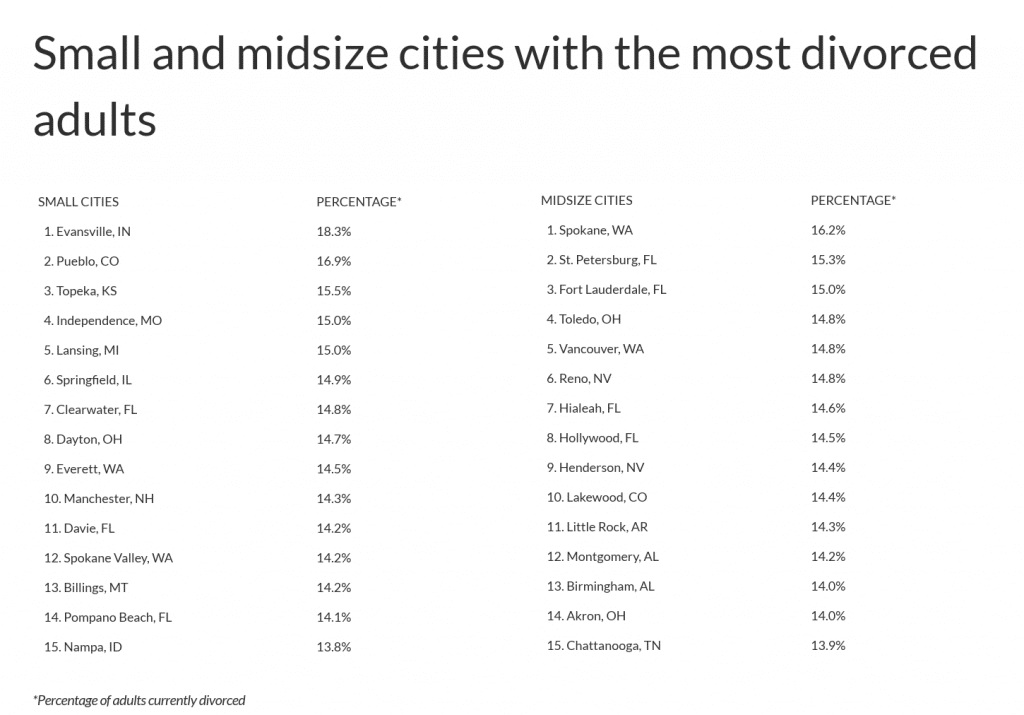
In contrast, Maine and Nevada lead all states in the share of the population currently divorced at 13.9% and 13.8%, respectively. And at the local level, many of the cities with the highest levels of divorce are found in Florida, Appalachia, and the Southwest.
DID YOU KNOW?
A stockbroker is a person or company that helps users trade standard investments like stocks, bonds, mutual funds, and ETFs. For details about the most popular online brokers like Fidelity and TD Ameritrade, check out our guide to choosing the best online stockbroker.
The data used in this analysis is from the U.S. Census Bureau’s 2020 American Community Survey. To determine the most divorced locations, researchers at ChamberOfCommerce.org calculated the percentage of adults currently divorced. In the event of a tie, the location with the higher percentage of adults currently separated was ranked higher. To improve relevance, only cities with at least 100,000 residents were included. Additionally, cities were grouped into cohorts based on population size: small (100,000–149,999), midsize (150,000–349,999), and large (350,000 or more).
Here are the most divorced cities in the U.S.
Large Cities With the Most Divorced Adults

15. Aurora, CO
- Percentage of adults currently divorced: 12.7%
- Percentage of adults currently separated: 2.0%
- Percentage of adults currently married: 46.1%
- Percentage of adults never married: 34.9%
TRENDING
More than half of all U.S. employees claim to actively seek new employment or watch for job openings, while nearly 60% of job seekers say they go to a job board or job search engine when searching for career opportunities. These are the best job search engines in 2022.

14. New Orleans, LA
- Percentage of adults currently divorced: 12.8%
- Percentage of adults currently separated: 2.7%
- Percentage of adults currently married: 28.5%
- Percentage of adults never married: 50.3%

13. Oklahoma City, OK
- Percentage of adults currently divorced: 12.9%
- Percentage of adults currently separated: 2.3%
- Percentage of adults currently married: 45.1%
- Percentage of adults never married: 34.2%
12. Colorado Springs, CO
- Percentage of adults currently divorced: 13.0%
- Percentage of adults currently separated: 1.5%
- Percentage of adults currently married: 49.9%
- Percentage of adults never married: 31.1%

11. Louisville/Jefferson County, KY
- Percentage of adults currently divorced: 13.0%
- Percentage of adults currently separated: 2.0%
- Percentage of adults currently married: 41.9%
- Percentage of adults never married: 36.6%

10. Kansas City, MO
- Percentage of adults currently divorced: 13.3%
- Percentage of adults currently separated: 2.2%
- Percentage of adults currently married: 39.7%
- Percentage of adults never married: 39.7%

9. Wichita, KS
- Percentage of adults currently divorced: 13.5%
- Percentage of adults currently separated: 1.9%
- Percentage of adults currently married: 45.9%
- Percentage of adults never married: 33.4%

8. Tampa, FL
- Percentage of adults currently divorced: 13.5%
- Percentage of adults currently separated: 2.4%
- Percentage of adults currently married: 38.5%
- Percentage of adults never married: 40.5%

7. Cleveland, OH
- Percentage of adults currently divorced: 13.5%
- Percentage of adults currently separated: 3.4%
- Percentage of adults currently married: 24.7%
- Percentage of adults never married: 52.3%

6. Miami, FL
- Percentage of adults currently divorced: 13.5%
- Percentage of adults currently separated: 3.5%
- Percentage of adults currently married: 36.8%
- Percentage of adults never married: 39.8%

5. Las Vegas, NV
- Percentage of adults currently divorced: 13.8%
- Percentage of adults currently separated: 2.0%
- Percentage of adults currently married: 43.8%
- Percentage of adults never married: 35.3%

4. Jacksonville, FL
- Percentage of adults currently divorced: 14.0%
- Percentage of adults currently separated: 2.2%
- Percentage of adults currently married: 42.3%
- Percentage of adults never married: 35.8%

3. Tucson, AZ
- Percentage of adults currently divorced: 14.3%
- Percentage of adults currently separated: 2.3%
- Percentage of adults currently married: 35.7%
- Percentage of adults never married: 42.5%
LEARN MORE
One path to financial freedom is to start and grow a successful business, and every business needs a website. Get your dream of financial freedom started by learning about the best, free website builders available.

2. Tulsa, OK
- Percentage of adults currently divorced: 14.6%
- Percentage of adults currently separated: 2.5%
- Percentage of adults currently married: 42.2%
- Percentage of adults never married: 34.7%
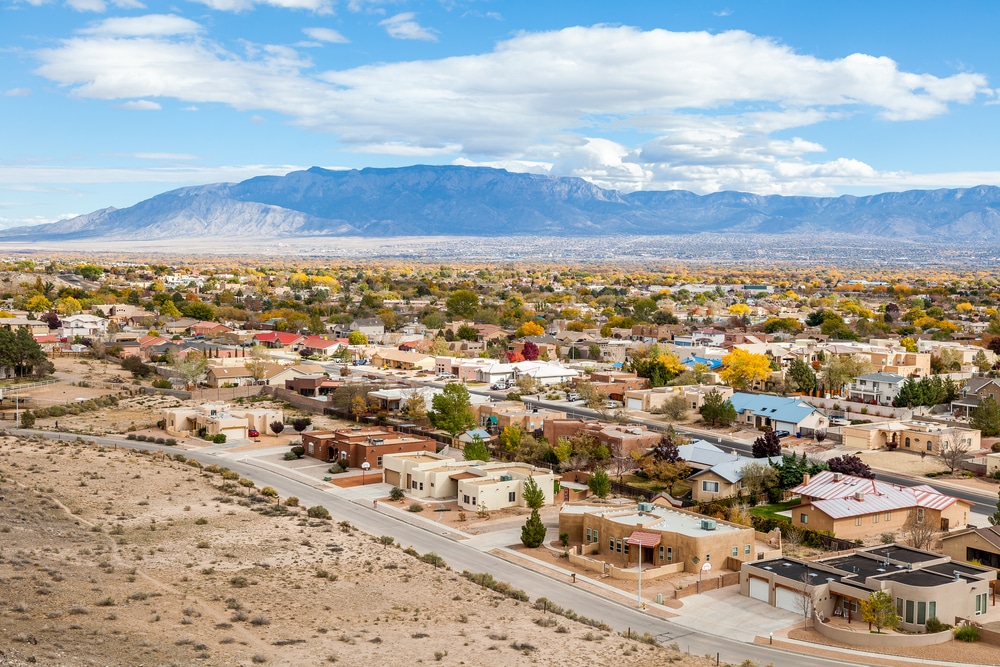
1. Albuquerque, NM
- Percentage of adults currently divorced: 15.1%
- Percentage of adults currently separated: 1.4%
- Percentage of adults currently married: 39.8%
- Percentage of adults never married: 38.2%
Detailed Findings & Methodology
The data used in this analysis is from the U.S. Census Bureau’s 2020 American Community Survey. To determine the most divorced locations, researchers calculated the percentage of adults currently divorced. In the event of a tie, the location with the higher percentage of adults currently separated was ranked higher. It is important to note that the category “currently married” excludes those married but “currently separated,” and that the percentages don’t sum to 100% because the “currently widowed” percentage is omitted. To improve relevance, only cities with at least 100,000 residents were included. Additionally, cities were grouped into cohorts based on population size: small (100,000–149,999), midsize (150,000–349,999), and large (350,000 or more).